Insights to Fuel Decision Making
How do you make sense out of a bunch of transaction and account data? One of the first ways is to visualize it with charts and graphs and reports. MyFinancials does that and more!
Insightful Charts, Graphs, Reports
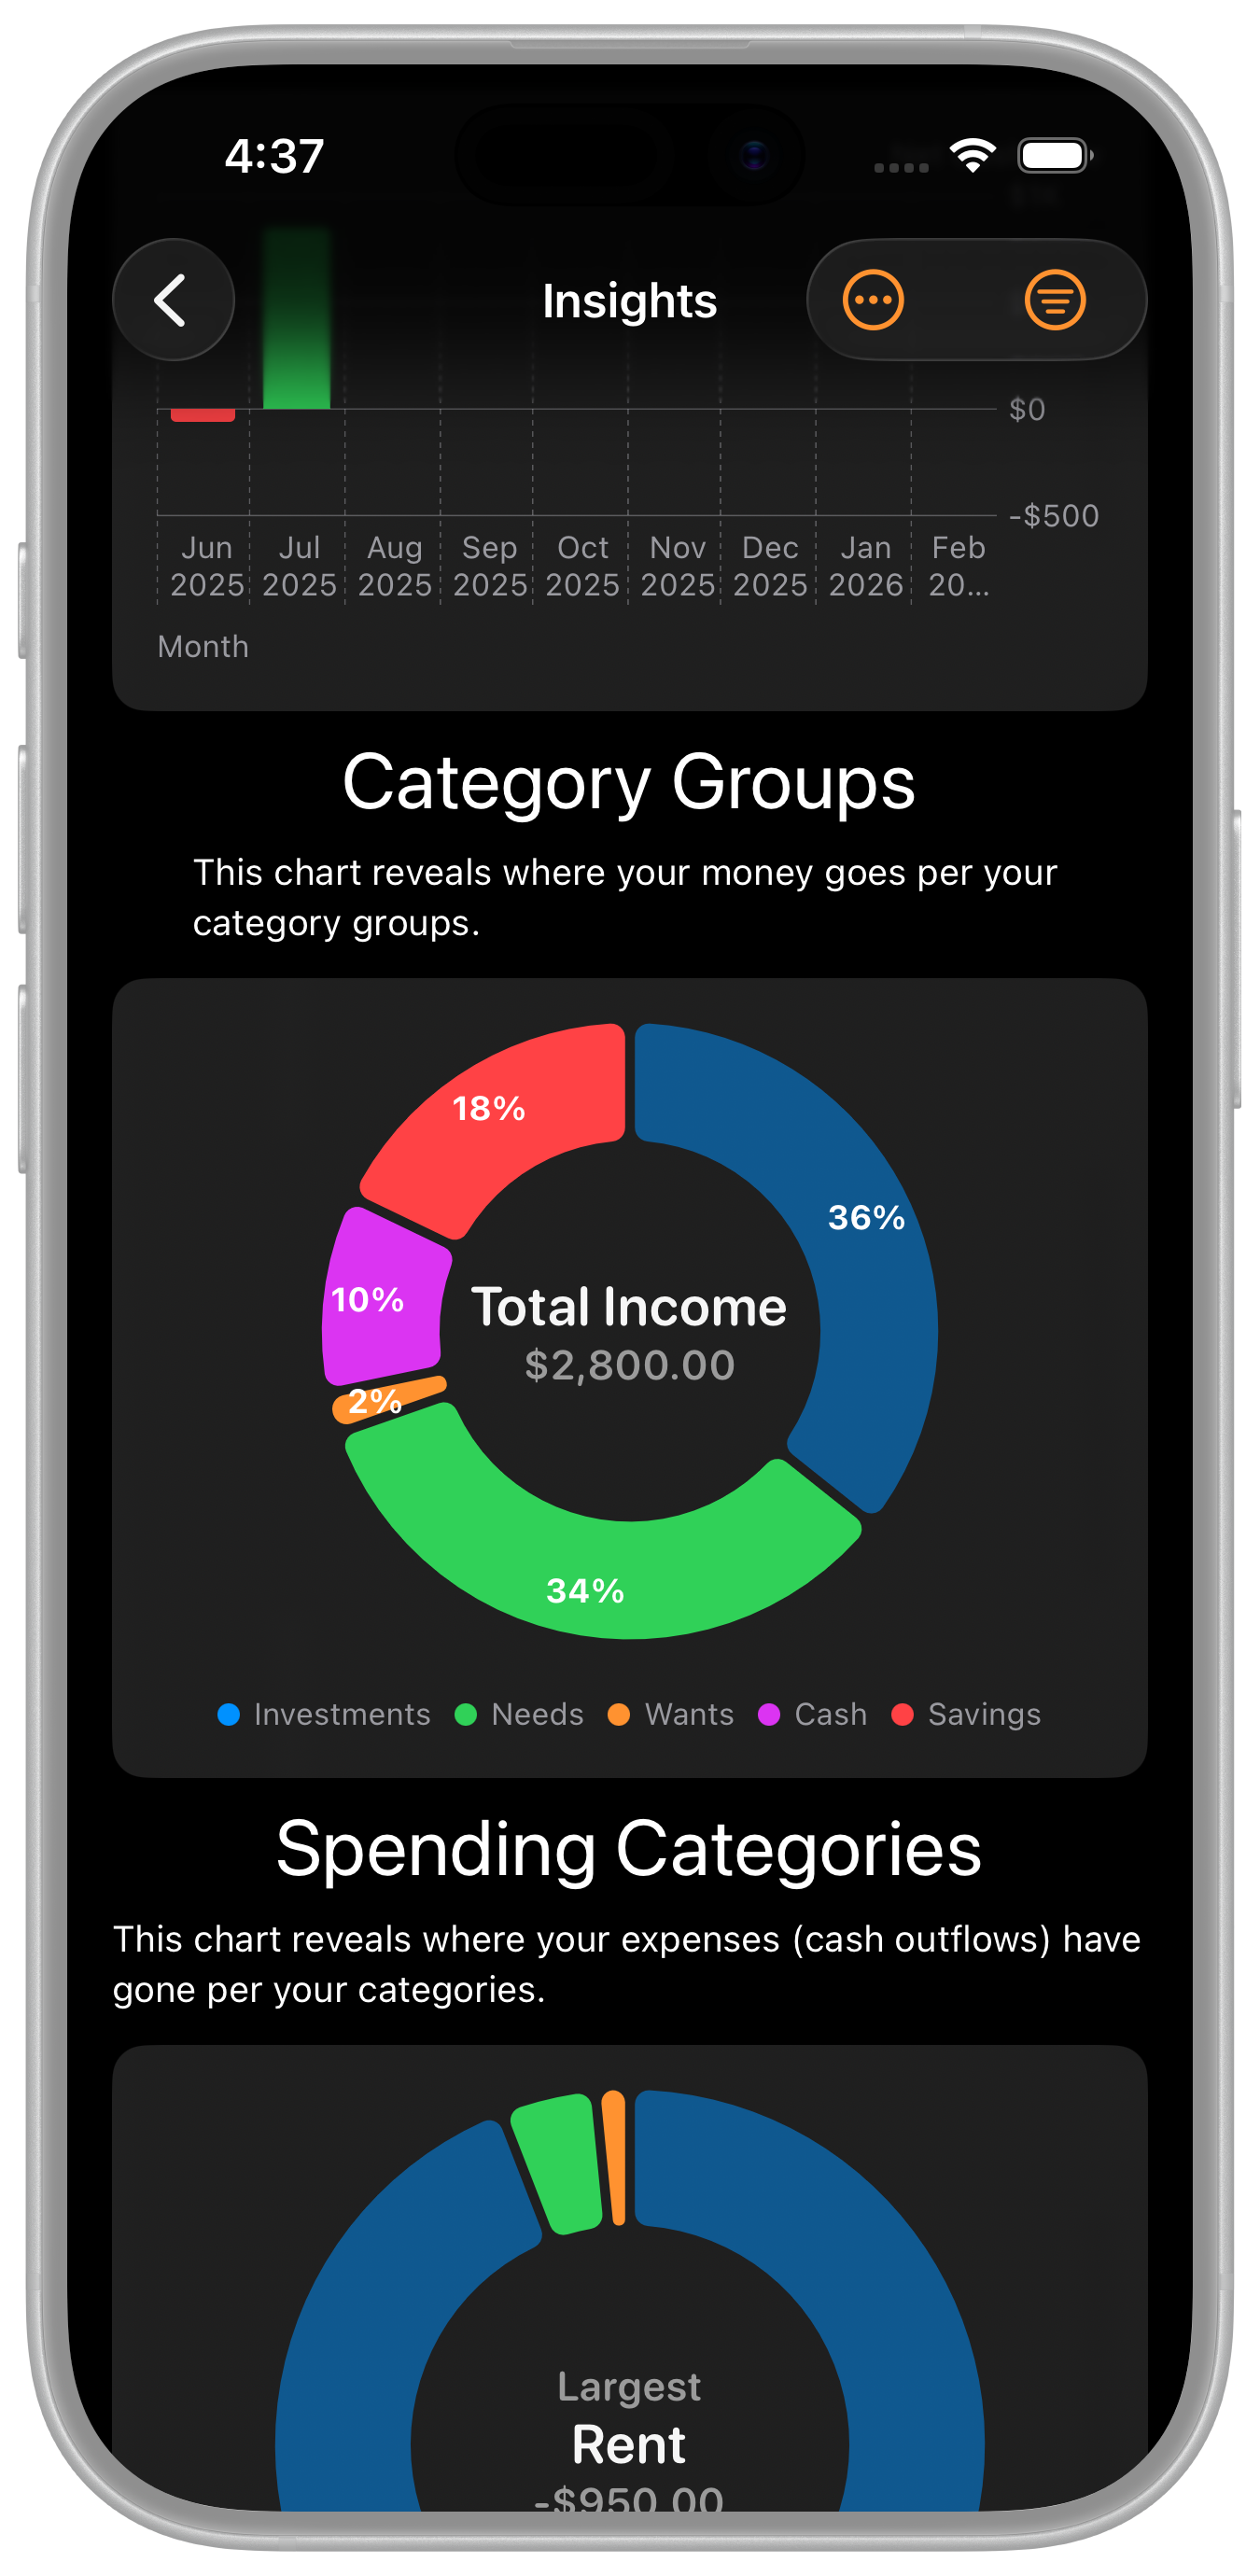
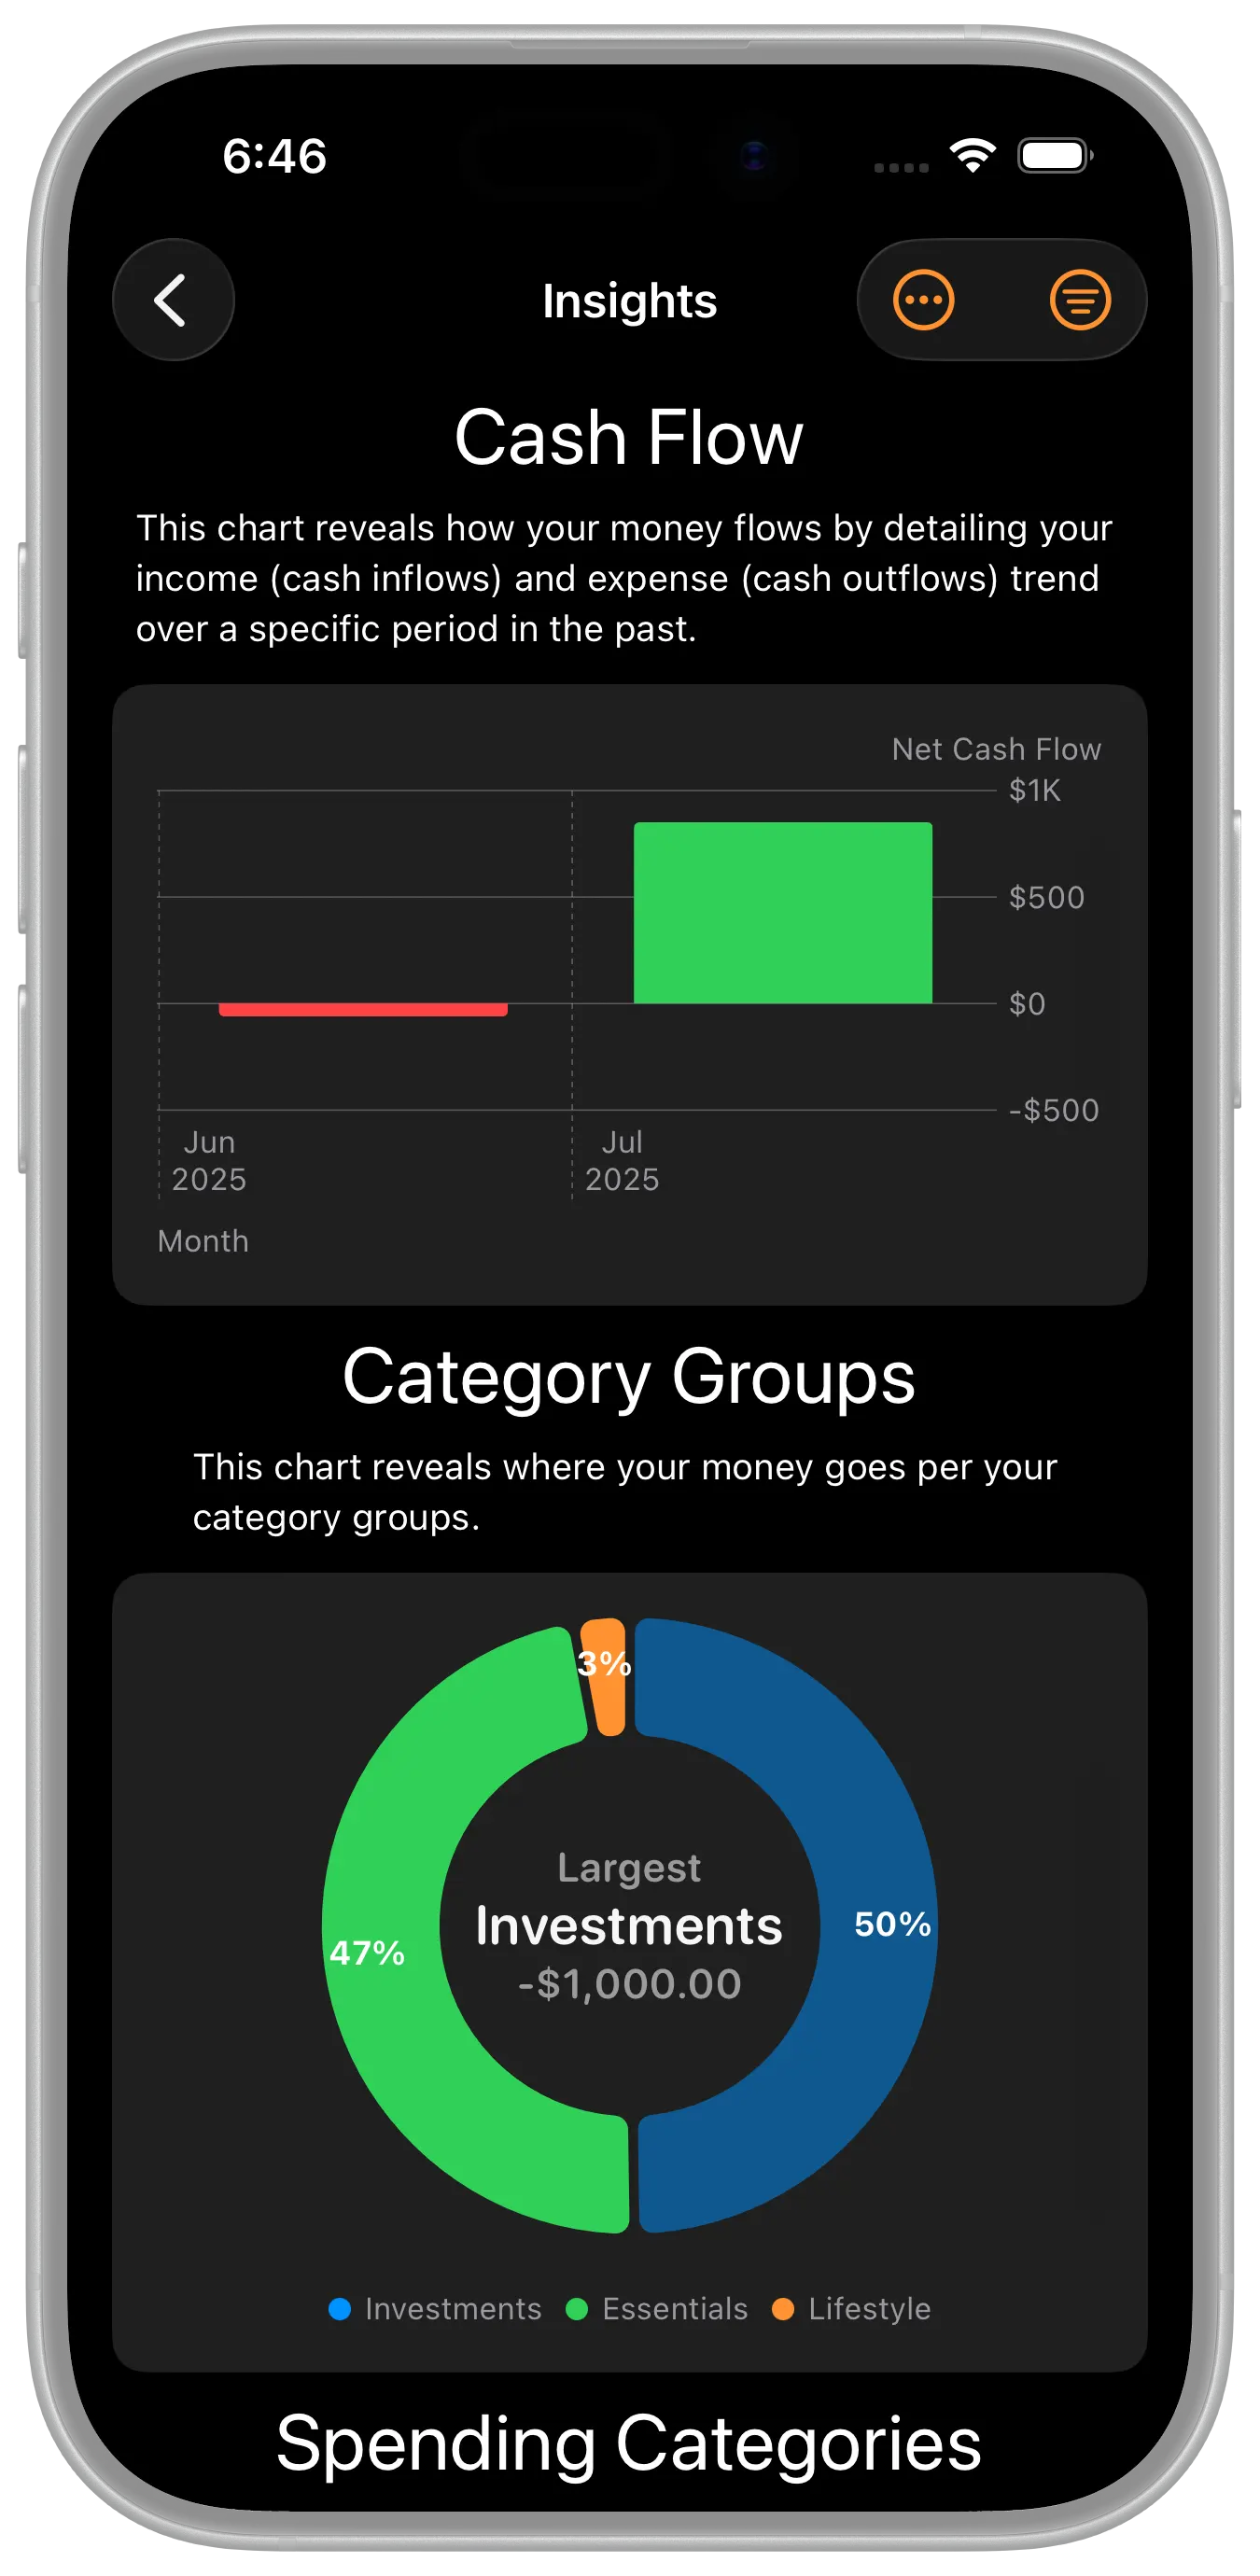
We included charts, graphs, and reports throughout the app to ensure you've got all of the visuals to make good financial decisions. Here are the ones included in the Insights area:
- Cash Flow
- Spending Category Groups
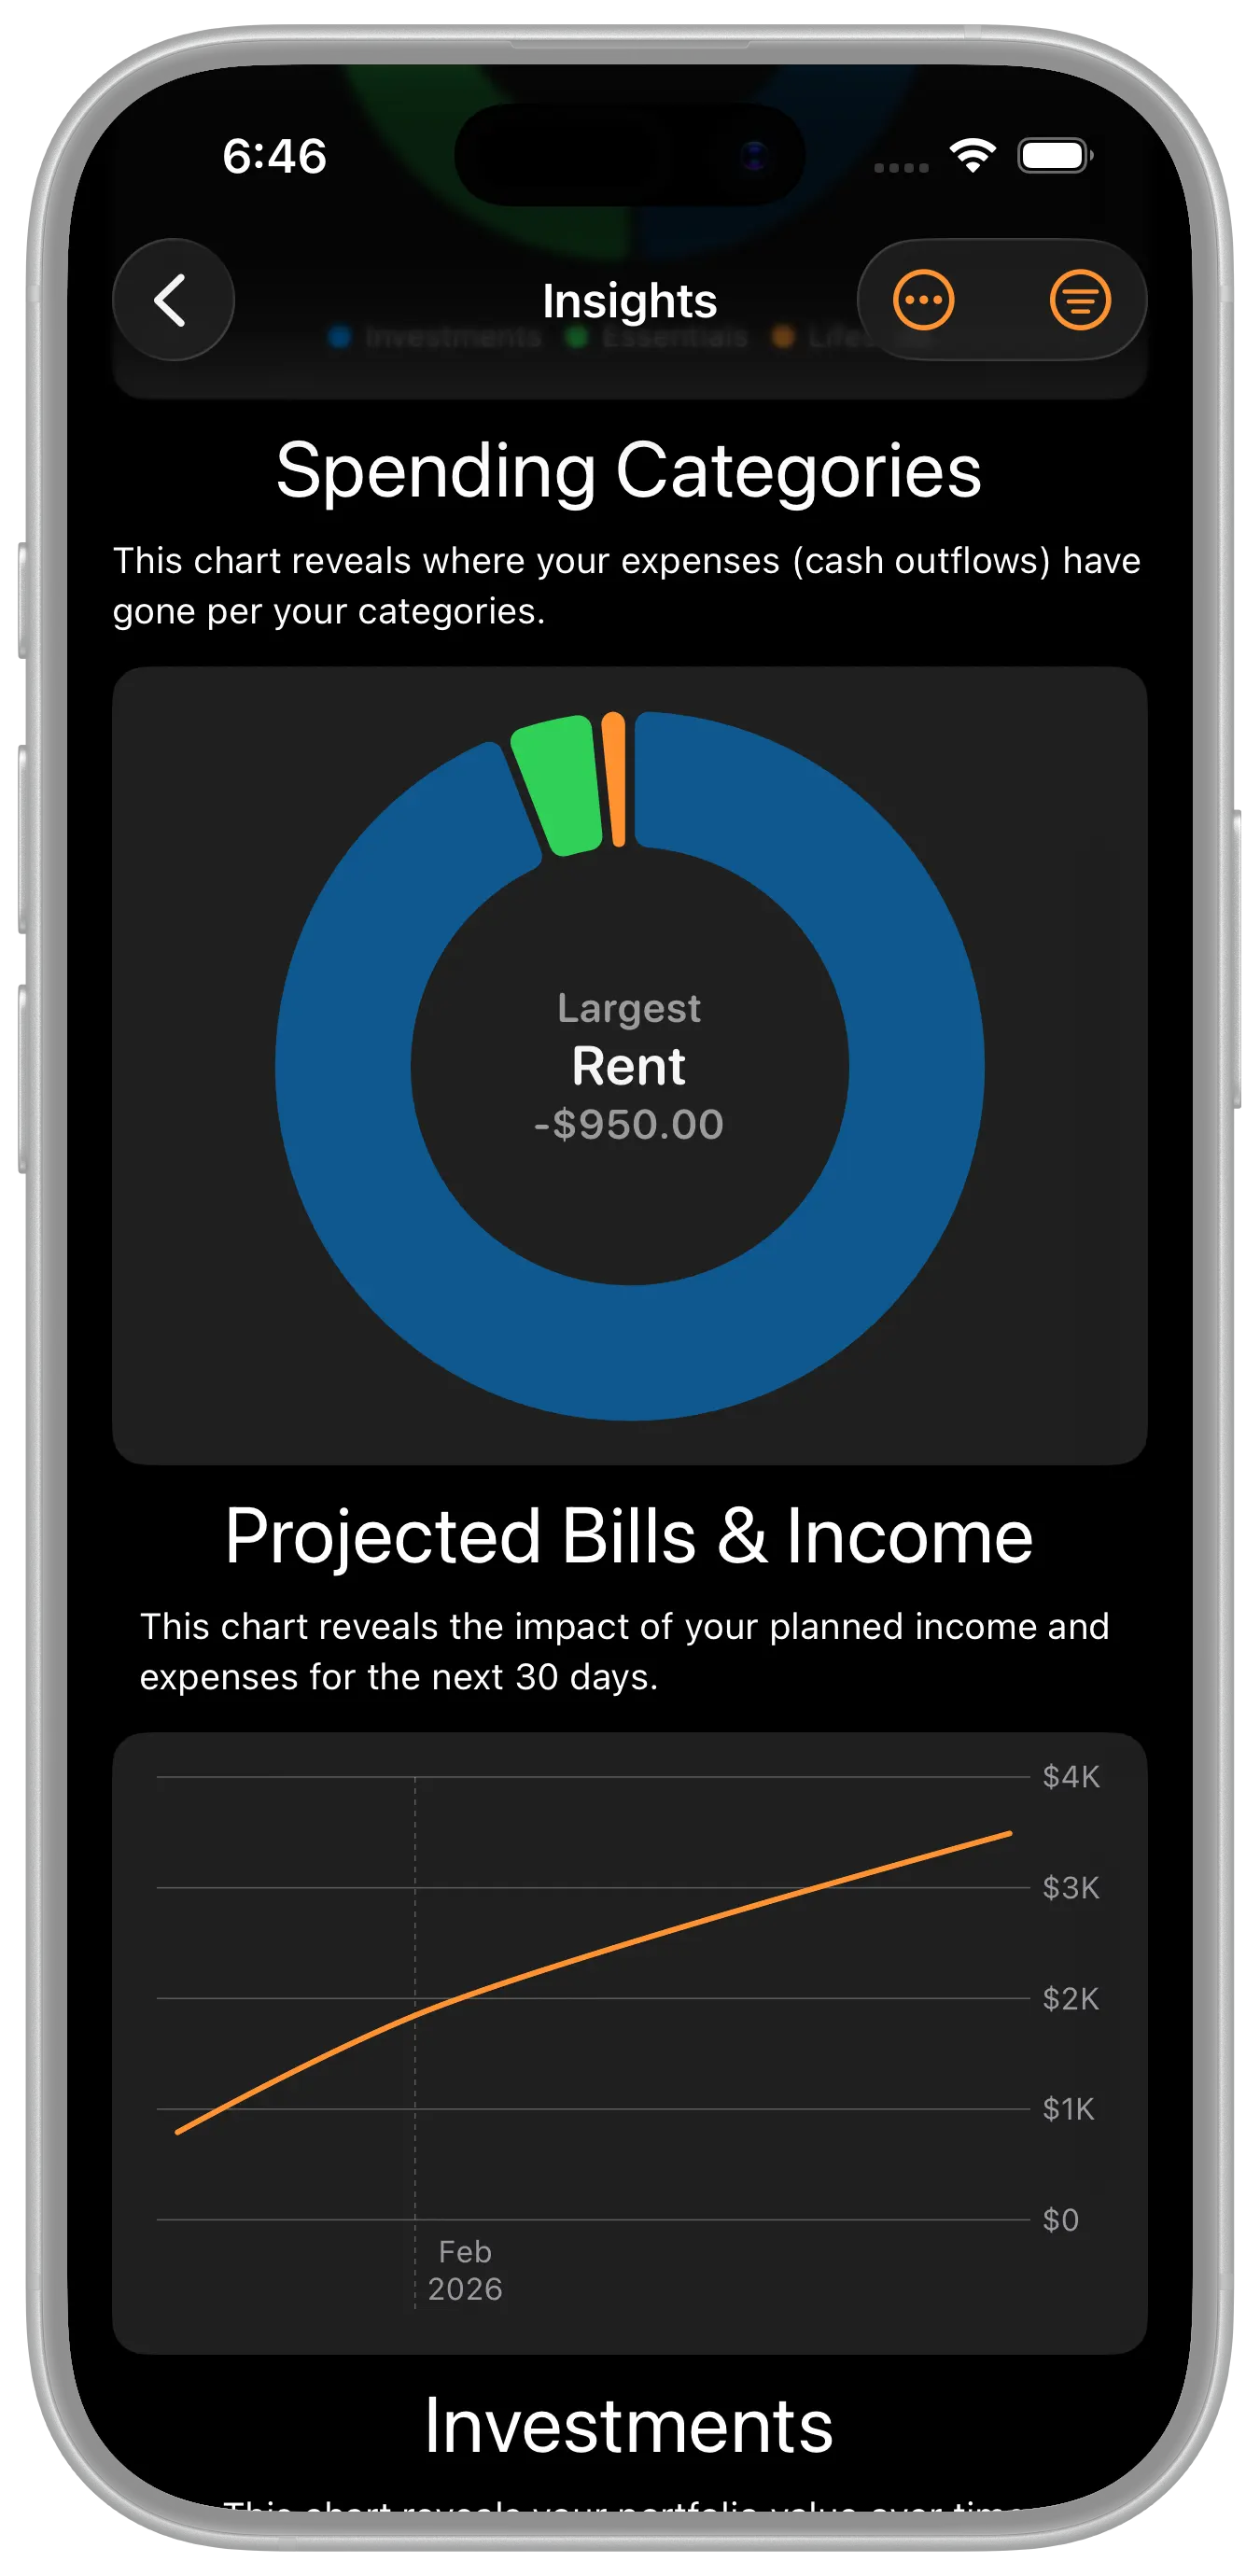
- Spending Categories
- Projected Bills & Income
- Investments
- Net Worth Over Time
- Tax Report
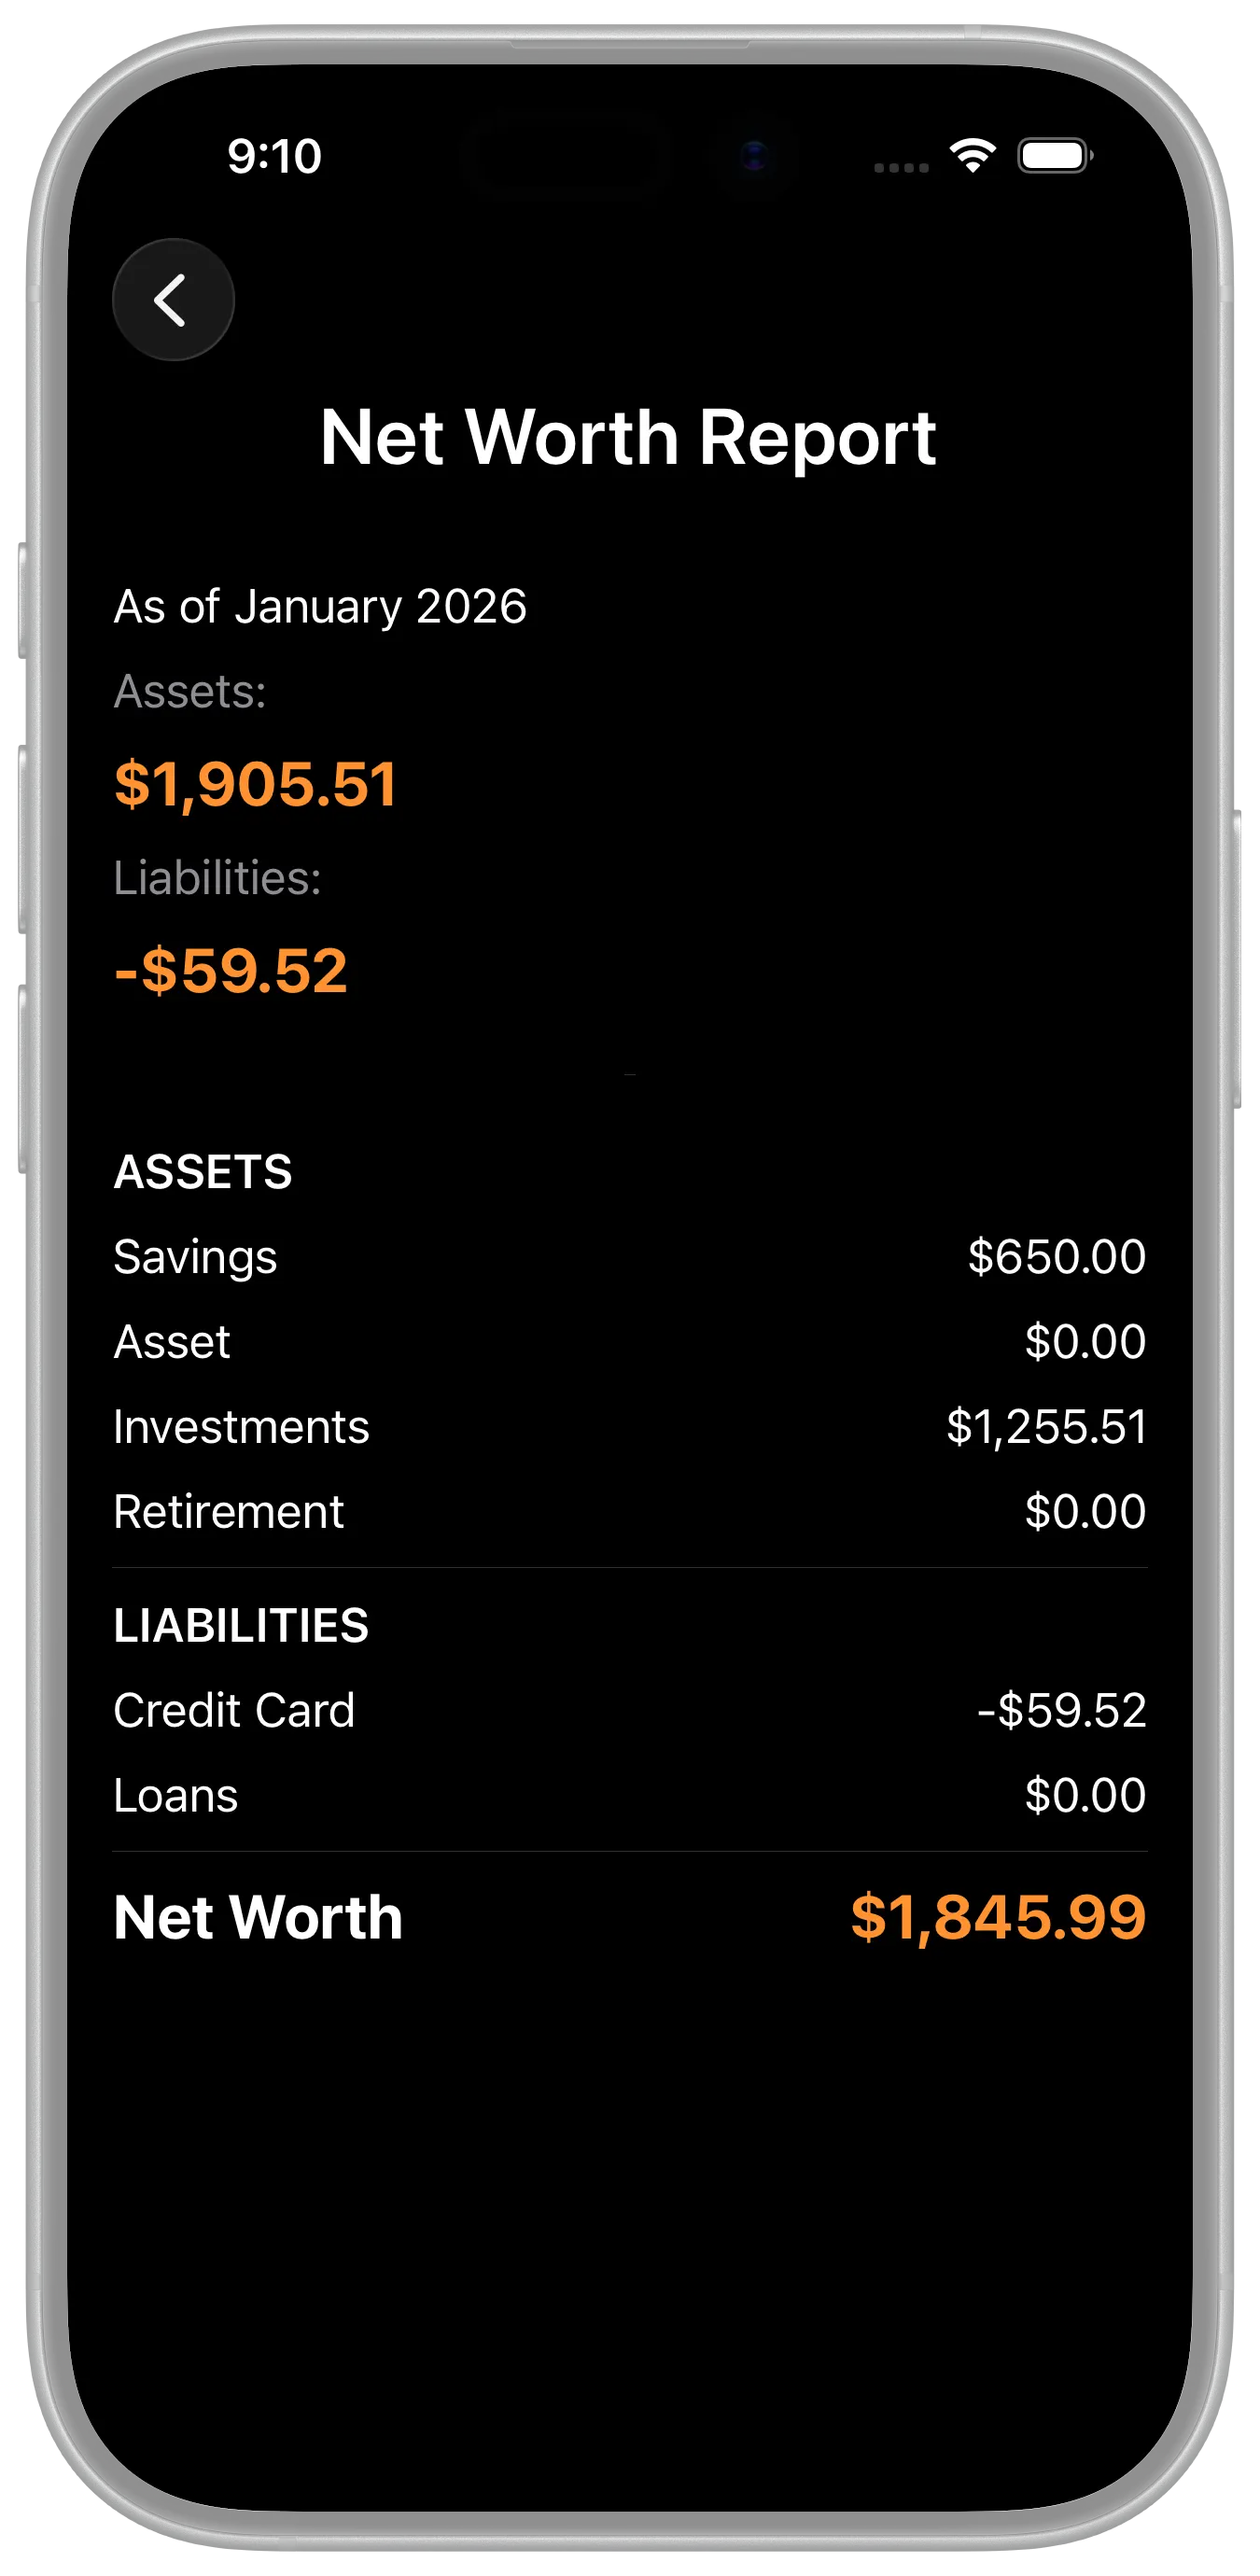
- Net Worth Report
- Category Report
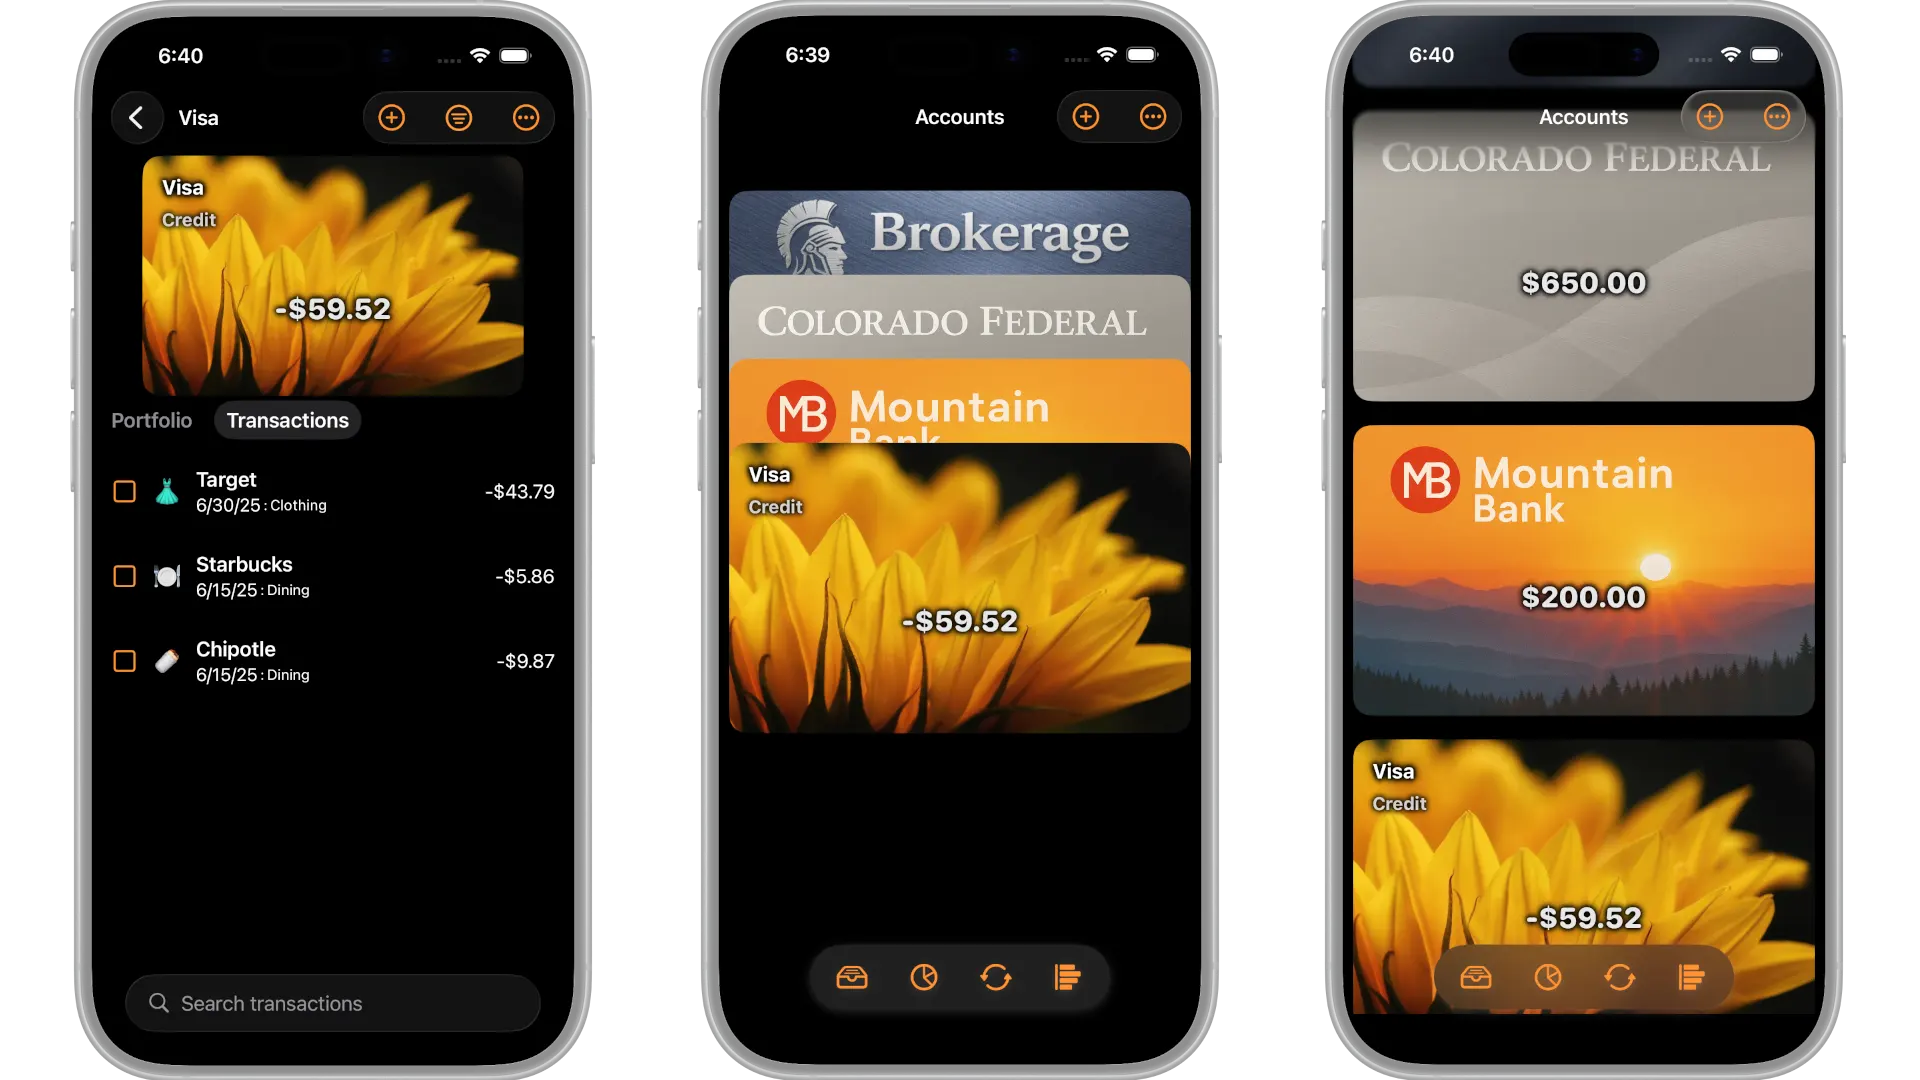
There are also graphs for stock portfolio holdings, spending, and income within the account transaction views. Use the filtering menu (spending, income) and the Portfolio selector to reveal those graphs.